Author
Craig Lefoe, CEO
How do we inspire others to make pragmatic sustainable change? In my lifetime, a key barrier I have observed is humanity’s weakness of accurately visualising the sheer damage and scale of our pollution. Which on the flip side also means a lack of vision in imagining and creating a more sustainable world. We mitigate what we measure, we measure what matters, and what matters is what we can visualise.
Inspiring ESG innovation
Data visualisation is playing and will continue to play an integral role in driving sustainable development and to inspire ESG innovation. Done well, data visualisations allow for multiple sustainability metrics like carbon, water, waste, to be visible and tell an interconnected ESG data story in how they interact with numerous other variables, quickly, clearly and simply.
A picture paints a thousand words and a handful of data visualisations could paint a billion more.
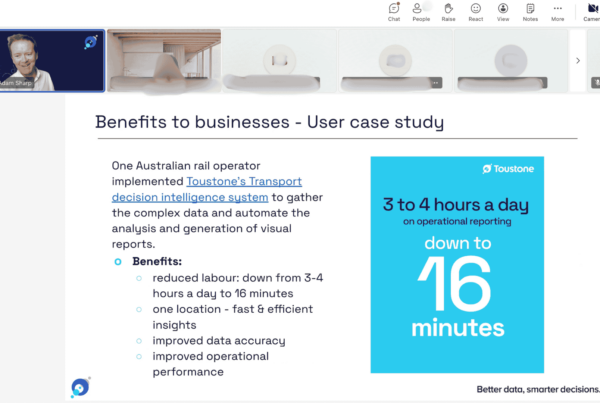
Graphical, purposeful and more colourful representation of data, enable people to pick up trends and patterns quickly. For example, if there is a spike in your energy use, you will want to see it visually straight away. You will want to be able to drill down and find out what is causing that spike and the impact of mitigating that spike on your overall and ongoing energy consumption efficiently. This is as opposed to spending countless hours trawling through numbers and spreadsheets to get to the same insight.
Time is of the essence when it comes to enacting sustainable change, which is why streamlined, accurate and fast sustainability visualisations based on a solid data foundation of a single source of truth are essential to any serious business operation.
Visuals clarify the complexity of sustainability
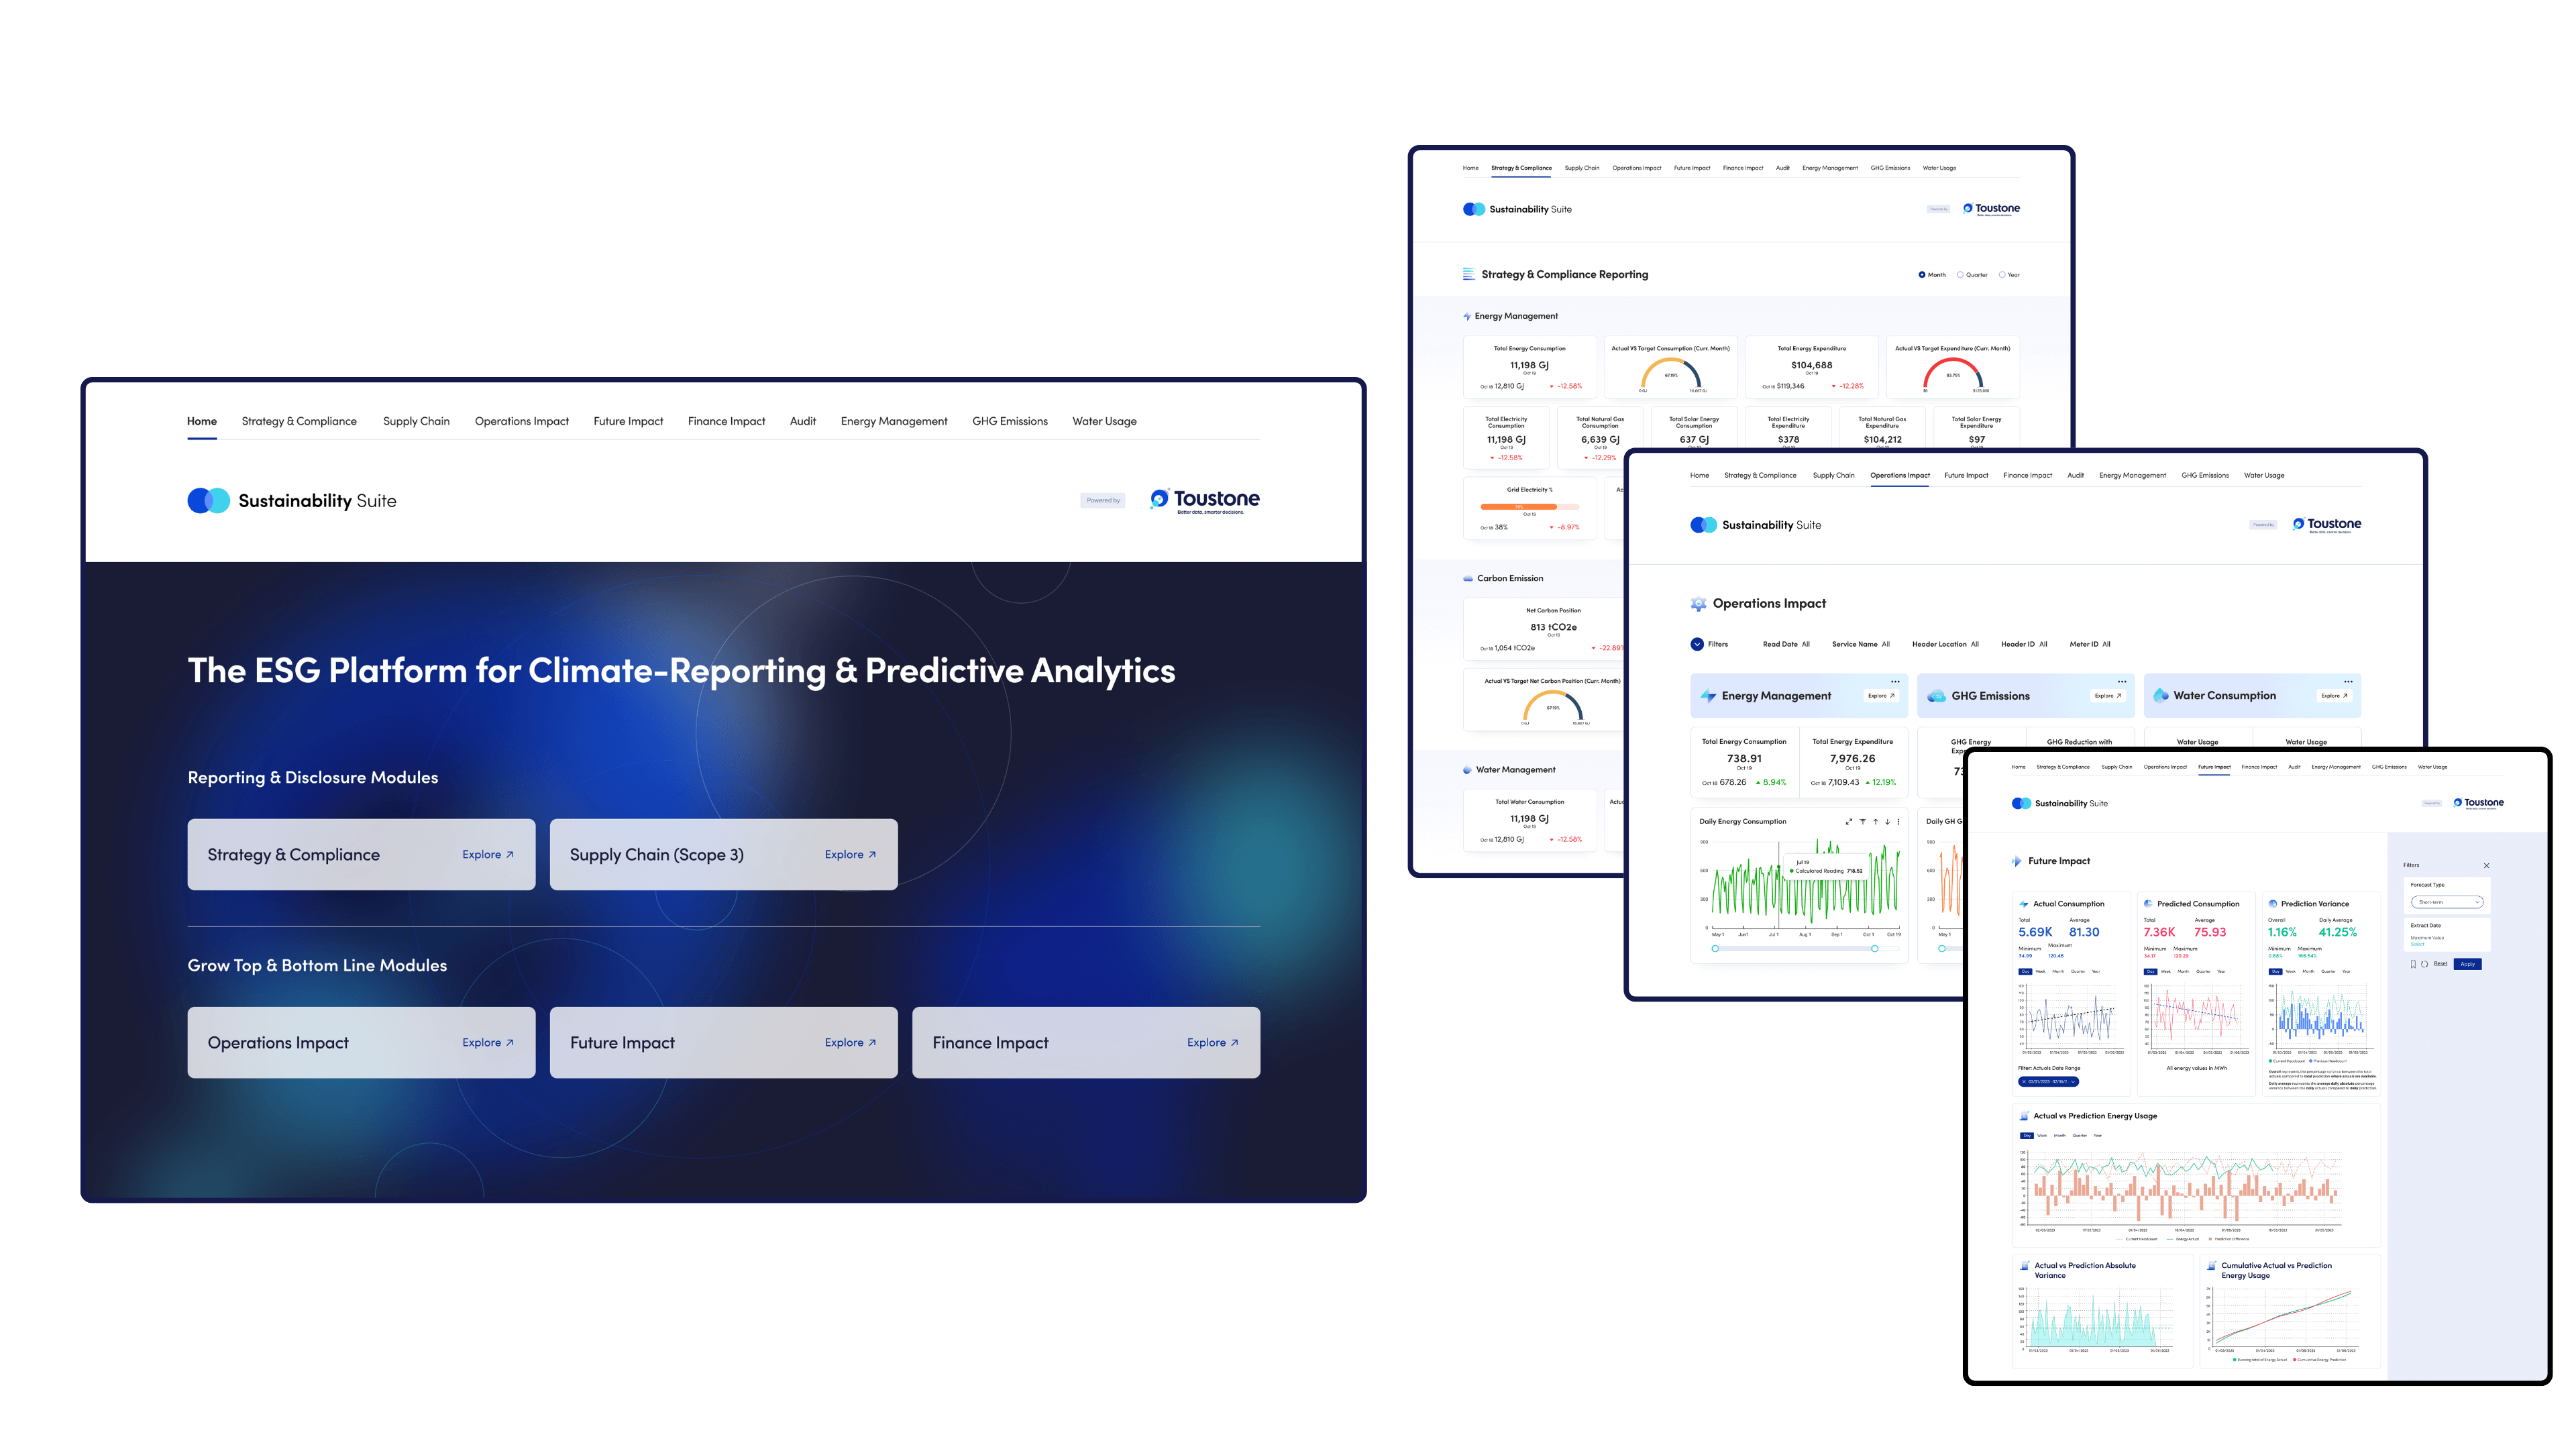
Depending on what your sustainability targets/goals are, you are going to be dealing with a lot of data. Renewable energy in its essence is decentralised, varied and can be intermittent. This is why our Sustainability Suite dashboard is designed to seamlessly bring together diverse data sets and extract meaning and predictive insights from multiple siloed sources across your business.
The Toustone Sustainability Suite is also designed to track performance against government mandates (based on AASB & ISSB IFRS S2 or any other standard) and is customisable for your organisation’s specific contractual mandates and sustainability strategies.
There are many different ways to present data
Most people get disoriented with rows, columns and pages of numbers. There are all sorts of creative ways to present data. And there is a science behind what resonates with people- those who have studied it know which type of visualisation will work best for the type of sustainability metric being measured for a particular audience; so the visualisation has maximum impact. Our team at Toustone design data visualisations based on best practice and principles of human centred design.
Ideally the way you present data, should be intuitive to the end user, to the extent where they should not need any training to use a visualisation dashboard, for whatever purpose: reporting, exec summaries, operational data drill down, strategic forecasting etc.
Insights for CEO's
For example, If I am a CEO of a company and have certain ESG goals I am reporting to government, the board or investors, I want to be able to see the executive view, or summary of what is going on when I begin in the morning, without getting lost in unnecessary detail. I want to be able to start my day knowing how my company is tracking at a very high level against our sustainability metrics. In this instance, a traffic light visualisation would work well:
- If I see green I know instantaneously we are meeting specific sustainability targets.
- Or if I see orange, I may need to find out more information to discern if that area is going to be a problem.
- If we are in the red, then I will need to drill down to find out what is causing that spike to our carbon footprint.
Insights for teams
My operational team may need to drill down even further into sustainability trends and transactional data within the platform to be able to take action.. For example, our Sustainability Suite allows for this type of specific data capture and reporting, to see what’s working and what’s not at multiple levels, quickly.
Consistency and clarity are important in data visualisation, so your eyes and mind are not having to readjust, recalibrate, every time new data is captured.
Australian leaders: We need to embrace innovation today
In summary, all of us need to make significant changes to meet the ESG challenges before us, and we need to do this quickly. The speed at which visualisations can communicate, based on predictive analytics and machine learning is an essential tool going forward.
We have a number of data visualisation experts, big picture sustainability strategists as well as business analysts happy to discuss specific solutions for your business goals.
If you would like more detail on how to catapult corporate sustainable change with a one-on-one conversation – no charge.